
Housing Market Signals to Watch For

The housing market has been crazy over the past few years. While there have always been periods of ebbs and flows, buyer's markets and seller's markets, yet the frenetic pace and swings since the start of the pandemic has had everyone on edge. Now that interest rates have climbed back to more "normal" levels, those in the market is wondering, "what's next?".
For anyone interested in buying or selling real estate, it can feel like a guessing game. Is it the right time to sell? Can I get the best price? Should I buy a home this spring? Will interest rates go up or down? It can feel overwhelming.
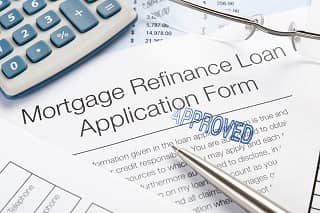
Yet, there are signs that can help consumers make the right decisions for themselves and their families. As spring market starts, there are signs that indicate a strong real estate market. New mortgage applications are rising again - indicating buyers are starting to look at their options.
Housing market indicators determine the best time frame for profitable real estate transactions. Real estate professionals, like myself, and potential buyers and sellers must examine these indicators before taking the steps in the real estate process. Below are a list of housing market indicators to look out for:
Local Housing Affordability
The Housing Affordability Index assesses an individual's ability to secure a mortgage on a median-priced home at both the national and regional levels. It is measured based on average household income and most recent home price data. Homeowners should have a house that they can not only pay for, but still have enough money left over for necessities such as, food, healthcare, and transportation.
An affordable home consumes no more than 30% of a household's gross income. Homeownership affordability is low if the average income doesn't qualify for a mortgage. On the Housing Affortability Index, a household with a median income has enough incoming funds or salary to qualify for a mortgage on a median-priced house when the value is equal or more than 100. A score of less than 100 indicates that the family's income is insufficient to qualify for a mortgage on a median-priced home.
Current Housing Affordability
According to the National Association of REALTORS® housing index statistics, the affordability index was lower at 101.2 in December 2022 compared to 142.2 in December of 2021. This housing affordability index stats means that a household has enough funds and can qualify for a mortgage on a median-priced home.
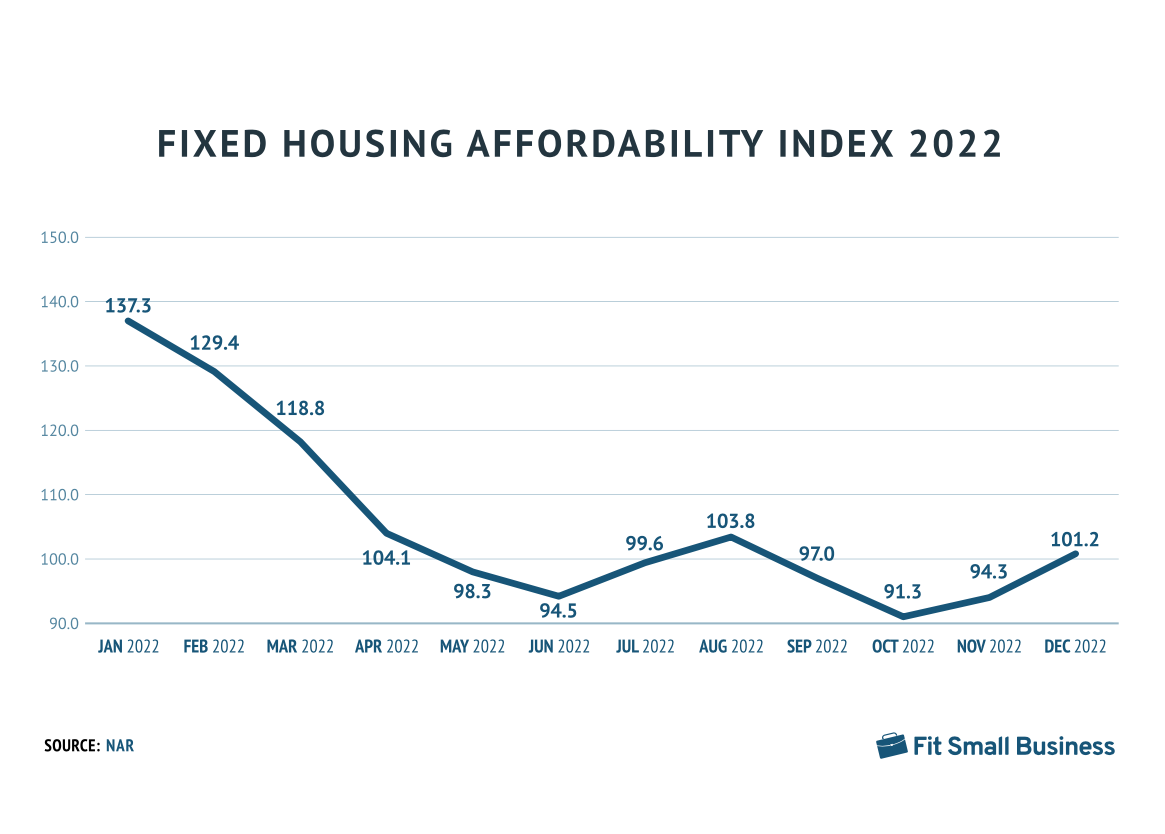
While the Housing Affordability Index remains over 100, the declining trend since May 2022 demonstrates decreasing house affordability. Home prices will continue to rise due to inflation as housing inventory decreases. Mortgage rates will also rise to battle inflation, potentially driving up prices even more and reducing housing affordability.
Interest Rates
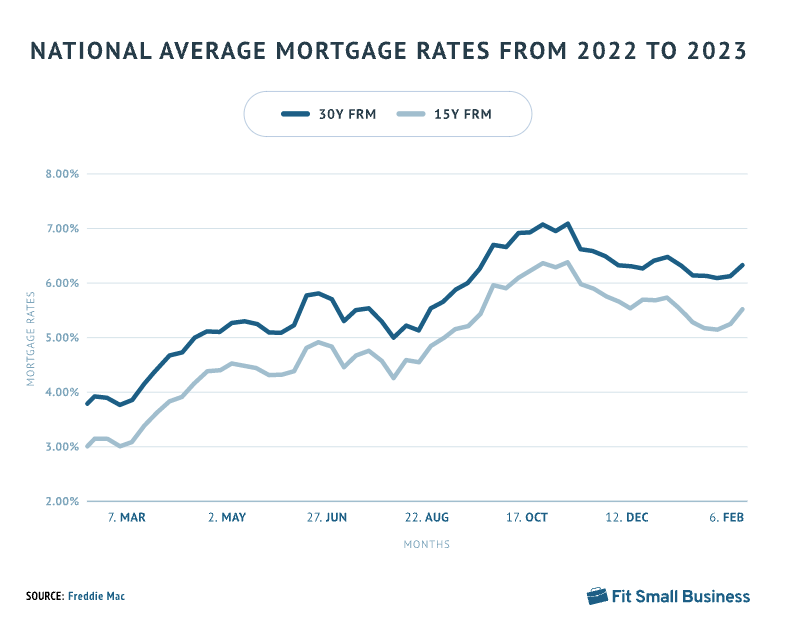
An interest rate, or "mortgage rate", is the money a borrower must pay back to a lender over time for borrowing the money to purchase the home. The interest is a proportion of the amound owed, known as the "principal".
Current Interest Rates
Compared to the historic low rates of 2021, interest rates in 2022 increased to combat inflation. 30-year fixed mortgage rates have risen from 3.92% in Feb 2022 to 6.32% in Feb 2023.
Median Days on Market
Days on Market (DOM, alternatively active days on market, market time, or time on market) is the total number of days a home is on the market from when it's first listed to when the seller signs a sales contract. Understanding the days on market and how it can effect the housing market in general, allows you to gauge how active the real estate market is in your area.
Higher DOM
- Less buyers & less competition
- Issues with the property
- Overpriced
- Unmotivated Seller
Lower DOM
- More buyers & more competition
- Highly desirable property
- Underpriced or priced right
- Motivated Seller
Current Days on Market
With low mortgage rates and property inventory, houses sold faster in 2022 than in previous years. Based on data from the Minneapolis Area REALTORS® Association properties stayed on the market for an average of 35 days in March 2022 compared to 58 days in March of 2023.
If you plan to buy a house in 2023, expect high asking prices, bidding wars, and rejected offers. According to NAR, homes listed received an average of 2.5 offers this month, down from 3.9 offers in January 2022.
Housing Inventory
Housing Inventory is the term for number of properties currently for sale. Supply and demand dictates, more inventory means less pressure to raise housing prices while less inventory encourages higher sales prices.
Current Housing Inventory
The housing inventory has fluctuated throughout 2022 and ultimately increased into 2023. However, housing inventory remains historically low.
If you're planning on buying a home in 2023, keep an eye out for more current listings. If mortgage rates continue to rise, supply may outstrip demand. This may give you more flexibility in negotiating the sales price.
If you're planning on selling a home in 2023, a higher supply and lower demand with undoubtably result in a lower sales price. However, demand typically rises in the spring and summer months (at least in Minnesota).
Time of Year
Seasonality in real estate refers to a particular time of year and how it imacts the housing market. Spring and early summer in Minnesota tends to be the busiest real estate season of the year - with the highest demand and most homes sold. From April until August, this range is typicially set around holidays, school schedules, *weather*, and more.
If you're planning on buying a home in 2023, take a look at your timeline. Buying a home in the "off" season, may allow you to get a better bang for your buck - with less competition and motivated sellers.
If you're planning on selling a home in 2023, the spring/summer market will allow your home to be marketed to a larger pool of buyers (potentially getting you more offers and a higher sale price due to demand), however, the "off" season will usually bring more serious home buyers.
Rental Market Trends
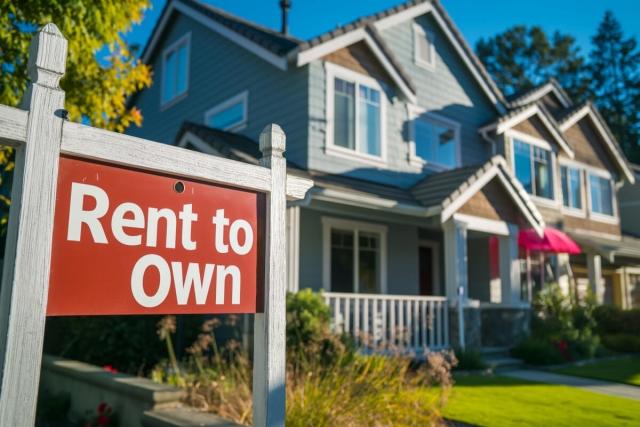
The rental market has the potential to influence home sales. Rents surge due to little rental inventory combined with high rental demand - which then snowballs into higher property prices, interest rates and inflation. Long-term renters may decide to buy a property since the the fixed cost of homeownership can be less expensive than increasing rents.
Current Rental Market
As of January 2023, the median rental costs roughly $1660/mo for a 777sq. ft. apartment in Minneapolis. In some cases, the cost to rent a home in the Minneapolis metro area tends to surpass the cost of paying a mortgage and owning a home.
Bottom Line
Realtor.com predicts that 2023 might turn into a "nobody's market", unfavorable to buyers or sellers. The slowdown in home sales transactions that started when mortgage rates increased in 2022 with persist this year, moderating home price increases and moving the balance of the housing market away from sellers.
The key for both buyers and sellers is to keep their expectations reasonable. Experts do not expect a large rush of either buyers or sellers flooding the market, so this spring looks like an opportunity to slow down a bit, weigh options, and make a solid transaction without pressure.
Categories
Recent Posts


GET MORE INFORMATION